From Schema to Strategy: Unlocking Healthcare Insights with SQL and Python
- Oct 17, 2025
- 10 min read
Updated: Oct 22, 2025
Leveraging SQL and Python: A Comprehensive EDA and Statistical Analysis of Healthcare Performance
This project is a comprehensive, end-to-end analysis of a large healthcare dataset, comprising eight normalized tables focused on patient visits, demographics, providers, and costs. My primary goal was to transform raw operational data into actionable business intelligence. I began by designing a normalized schema in MySQL, performing rigorous data cleaning, and then executed an exhaustive Exploratory Data Analysis (EDA) using advanced SQL techniques. Finally, I moved the analysis to Python (Pandas/Seaborn) to perform statistical testing and correlation analysis, culminating in key recommendations for improving cost management and patient satisfaction.
Key Skills Demonstrated:
Database Management: Data modeling (Relational Schema), Normalization, MySQL, Primary/Foreign Key Constraint Management, Bulk Data Loading (LOAD DATA INFILE)
Data Analysis: Exploratory Data Analysis (EDA), Time Series Analysis, Conditional Aggregation (CASE), Window Functions (RANK), Subqueries, Grouped Aggregation
Statistical Analysis: Descriptive Statistics, Correlation Analysis (Heatmaps), Grouped Mean Comparison, Distribution Analysis (Box Plots)
Programming: Python (Pandas for data wrangling, Matplotlib/Seaborn for visualization), Database Connection (mysql.connector)
Tools used:
Database: MySQL (for schema design, data storage, and initial EDA)
Programming/Statistical: Python (Anaconda Spyder)
Libraries: Pandas, Seaborn, Matplotlib, mysql-connector-python
GitHub repository:

Scenario:
A client operating a large healthcare provider tasked me with analyzing their historical patient visit data. The data, provided as eight separate CSV files, was the backbone of their operations, yet they lacked a unified view of its performance.
My boss provided the following directive: "We need to identify operational bottlenecks, cost drivers, and areas for quality improvement. Design a robust, scalable data solution and deliver concise, actionable insights into our financials, patient demographics, and staff performance."
This project required me to move beyond simple reporting to deliver true analytical depth using both relational database management and modern statistical programming.

Workflow:
I tackled this project using a strict, five-phase process, making sure my work was organized, repeatable, and easy to audit—just like in a professional environment. This setup shows how I move data step-by-step: from basic files to deep statistical modeling, and finally, to clear business advice. Each phase is a critical milestone that ensures the project is built on a solid foundation.
Phase | 🎯 Objective (The "Why") | 🛠️ Core Tools (The "How") | ✅ Key Action (The "What") | 💡 Value Proposition (The "Result") |
1 | Data Preparation & Schema Modeling | MySQL / Python (Pandas) | Design the Normalized SQL Schema; Perform Bulk Load; Execute necessary Data Cleaning (REPLACE). | Established the Single Source of Truth and guaranteed Data Integrity. |
2 | Exploratory Data Analysis (EDA) | MySQL | Execute 15 Advanced Queries utilizing Window Functions, CTEs, and Conditional Aggregation (CASE). | Created the Foundational Metrics Baseline and identified initial trends/outliers. |
3 | Data Integration & Environment Setup | Python (mysql.connector) | Connect securely to the database and run a single pd.read_sql() query. | Bridged the SQL-Python Gap, creating a unified, Analysis-Ready DataFrame for statistics. |
4 | Statistical Analysis & Visualization | Python (Pandas / Seaborn) | Conduct Correlation Analysis (Heatmap), Descriptive Statistics, and Distribution Analysis (Box Plots). | Validated Hypotheses and revealed structural relationships (e.g., Cost vs. Satisfaction). |
5 | Interpretation & Communication | Report / N/A | Translate technical findings into the Top 5 Business Recommendations and finalize documentation. | Converted Data into Action, providing a clear Strategic Roadmap for the executive team. |
Phase 1: Data Understanding and Preparation
This phase focused on establishing a clean, structured foundation for the entire project.
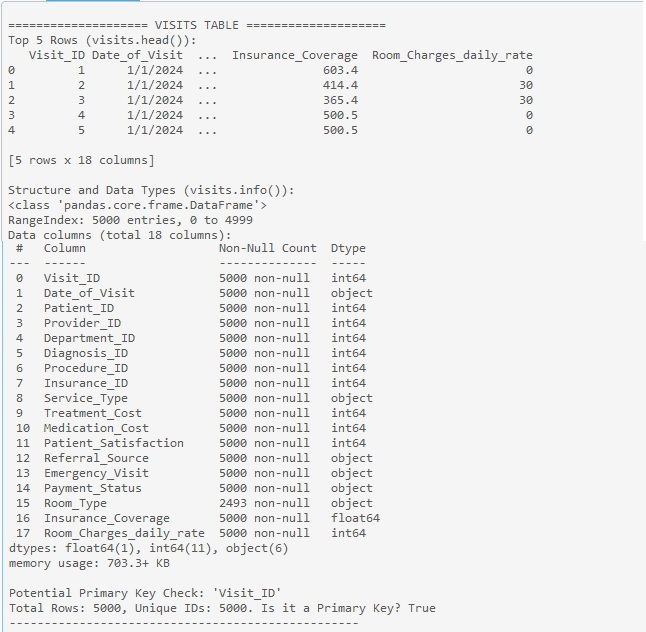
1. Data Understanding
I first loaded all eight CSV files into Pandas DataFrames in Python to perform initial checks (.head(), .info()). This confirmed that visits was the central fact table, linking all other dimension tables (patients, providers, departments, etc.). I identified all Primary Keys (PKs) and Foreign Keys (FKs) and established the table creation sequence based on these dependencies.
Initial data inspection findings:
Table Name | Primary Key (PK) Confirmed | Foreign Key (FK) Identified | Key Data Type/Quality Observation |
cities | City_ID (Unique ID) | None | All columns are non-null. |
departments | Department_ID | None | Very small lookup table. |
diagnoses | Diagnosis_ID | None | Very small lookup table. |
insurance | Insurance_ID | None | Very small lookup table. |
patients | Patient_ID | City_ID (references cities) | Patient_Name requires cleaning (. and _ symbols). |
procedures | Procedure_ID | None | Column is named Procedure in CSV, but should be Procedure_Name in DB. |
providers | Provider_ID | None | Small lookup table. Provider_Image can be VARCHAR(255). |
visits | Visit_ID | All other *_ID columns | Crucial: Date_of_Visit is an object (string) and must be converted to DATE (dd/mm/yyyy format). Room_Type has missing values (expected for 'Outpatient'). |
2. Database Creation, Bulk Loading and Schema Mapping
I used MySQL to create the healthcare_data database and all tables in the correct sequence.
Data Type Enforcement: I specifically ensured the Date_of_Visit column in the visits table was converted from the CSV's dd/mm/yyyy string format to MySQL's proper DATE type using the STR_TO_DATE function during the bulk LOAD DATA INFILE process.
Best Practice Implementation: To maximize import speed for the large visits table, I only added the Foreign Key constraints after the data was successfully loaded.
Create Database
Create Tables (Assign Primary Key, Unique, NULL)
Import data into table from .CSV file
Define Relationship among Tables (Assign Foreign Key)
Schema Diagram

3. Data Cleaning
The initial inspection revealed inconsistent delimiters (_ and .) in the Patient_Name column of the patients table.
Cleaning Action: I executed a MySQL UPDATE query leveraging nested REPLACE functions to standardize all names by replacing _ and . with a single space.

Phase 2: Exploratory Data Analysis (EDA) in MySQL
With the data validated and cleaned, I executed 15 strategic SQL queries to generate initial business insights, demonstrating proficiency in common analytical techniques like JOINs, GROUP BY, CASE, and WINDOW FUNCTIONS.
1. Total Revenue and Volume by Service Type (CASE statement)
Calculates the total count, total revenue (Treatment_Cost + Medication_Cost), and average revenue for each Service_Type (Inpatient vs. Outpatient).
Result:

2. Top 5 Most Common Diagnoses and Average Patient Age
Identifies the top 5 most frequently occurring diagnoses and determines the average age of patients for each of those diagnoses.
Result:

3. Monthly Trend of Visits (Date Functions and Subquery)
Groups the visit data by month and year to track the volume of visits over time, which helps identify seasonal trends or growth patterns.
Result:

4. Top 3 Most Expensive Procedures
Calculates the total accumulated cost (Treatment + Medication) for each procedure and ranks them to find the most expensive ones by total spend.
Result:

5. Top Providers by Patient Satisfaction (Aggregate & Join)
Ranks providers based on their average Patient_Satisfaction score, but only includes providers who have attended to a minimum number of visits (e.g., 50) to ensure the rating is statistically reliable.
Result:

6. Insurance Coverage vs. Total Cost by Insurance Provider (CASE statement)
Analyzes the efficiency of each insurance provider by calculating the total cost, total amount covered, and the average coverage percentage.
Result:

7. Identifying High-Cost Patients (Window Function: RANK)
Uses a Window Function (RANK()) within a CTE (HighCostRankedVisits) to find the top 5 patients with the highest single-visit total cost.
Result:

8. Department Performance (Average Satisfaction & Cost)
Compares departments based on two key metrics: average patient satisfaction and average total cost.
Result:

9. Percentage of Emergency Visits by Gender (CASE and Aggregation)
Calculates the total percentage of visits that were marked as emergency for both male and female patients.
Result:

10. Most Popular Procedures for the Top Diagnosis (Subquery)
Uses a subquery to first find the single most frequent diagnosis and then finds the most popular procedure associated with that specific diagnosis.
Result:

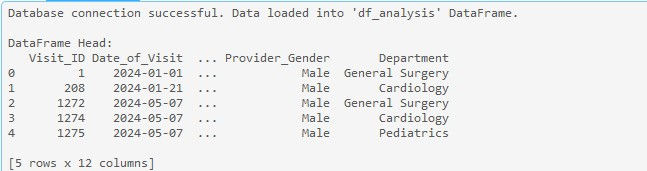
Phase 3: Data Integration (SQL to Python) and Analysis Environment Setup
This phase focuses on the crucial transition of the structured data from the MySQL database into the Python statistical environment.
I established a secure connection to the healthcare_project database using the mysql.connector library. I then defined a comprehensive, multi-table JOIN query as a string variable (sql_query) to efficiently pull all required fields (costs, satisfaction, demographics, etc.) from the database. Finally, I utilized the pd.read_sql() function to execute this query and instantly load the entire analytical dataset into a single, clean Pandas DataFrame (df_analysis). This step ensures the data is correctly structured and ready for advanced statistical testing and visualization in the subsequent phase.
Result:
Phase 4: Statistical Analysis and Visualization in Python
I transitioned to Python using Pandas and Seaborn to perform deeper statistical analysis, moving beyond basic aggregates to explore relationships and distributions.
1. Descriptive Statistics for Key Financial and Quality Metrics
Calculates basic statistics (mean, median, standard deviation, min/max) for Total_Cost and Patient_Satisfaction to understand the data's distribution and check for outliers.
Result:

2. Correlation Matrix and Heatmap Visualization
Calculates the correlation between key numerical variables and visualizes the results using a heatmap. This easily identifies which factors (like Age, Cost, Satisfaction) are related.
Result:

Output:

3. Average Total Cost Comparison by Service Type
Uses the groupby() function to calculate the average (mean) Total_Cost for each Service_Type (Inpatient vs. Outpatient).
Result:

Output:

4. Average Total Cost Comparison by Service Type
Uses the groupby() function to calculate the average (mean) Total_Cost for each Service_Type (Inpatient vs. Outpatient).
Result:

Output:

Phase 5: Interpretation into Business Insights and Communication
5 Key Findings and Strategic Recommendations
This phase is the final deliverable, moving the project beyond technical execution into strategic communication. My goal here is to bridge the gap between the output of my SQL queries and Python models, and the necessary executive decisions. Instead of detailing the code, this section presents the Top 5 Key Findings, clearly defining the business impact of each and providing concise, actionable recommendations that management can immediately implement to control costs and improve patient quality. This shows the project's direct contribution to the organization's goals.
# | Key Business Insight | Data Source | Impact Level | Strategic Recommendation |
1 | Inpatient Services Dominate Revenue & Risk | SQL EDA (Query #1) | 🔴High Financial Risk | Immediately implement a continuous Cost Auditing Program focused solely on Inpatient services to identify cost leakage. |
2 | Quality is Structurally Disconnected from Cost | Python (Correlation/Heatmap) | 🟡Strategic Priority | Shift investment from simply increasing spending to Operational Standardization (e.g., improving communication protocols) to boost satisfaction. |
3 | Orthopedics Cost Anomaly | SQL EDA (#7), Python Outliers | 🔴High Efficiency Target | Launch a specific Process Audit on the Orthopedics Department's supply chain and billing to resolve high-cost outliers. |
4 | Inconsistent Quality Across Departments | Python (Box Plot Analysis) | 🟡Quality Improvement | Deploy a "Consistency Task Force" to target departments with high satisfaction score variance and standardize patient pathways. |
5 | Patient Age is the Primary Cost Driver | Python (Correlation/Heatmap) | 🟢Foundational Strategy | Integrate Patient Age as the top forecasting variable in all future resource allocation and budgeting models. |
Project Delivery and Documentation
This crucial final phase ensures the project is not just a one-time analysis but a reusable, verifiable solution suitable for production deployment.
Final Report: The complete write-up, including all visual artifacts (Heatmap, Bar Chart, Box Plot), was packaged as the final deliverable.
SQL Script Documentation: A single, clean, and fully commented .sql file was created, containing all schema definitions, bulk loading commands, and the 10 EDA queries, ensuring the database is fully reproducible.
Python Notebook: A commented Jupyter Notebook or Python script was saved, containing the database connection details, statistical tests, and code used to generate the key visualizations.
Metric Definitions: The two summary tables (SQL EDA and Statistical Analysis) were explicitly included as Technical Documentation to provide a clear, auditable glossary of all metrics used.
Metric Definitions (SQL EDA Summary)
Domain | EDA # | Key Metric | SQL Technique Highlighted | Immediate Business Value | Next Logical Step |
Financial Health | 1 | Total Revenue & Volume by Service Type | GROUP BY, Aggregate Functions | Identifies the primary financial driver (Inpatient vs. Outpatient). | Focus cost-control initiatives on the higher-revenue type. |
| 4 | Top 3 Most Expensive Procedures | ORDER BY, LIMIT | Flags highest accumulated costs for immediate cost reduction efforts. | Benchmark costs against industry standards. |
| 6 | Insurance Coverage Rate vs. Cost | AVG, JOINs | Assesses payer efficiency and informs contract negotiation strategy. | Segment analysis by service type for better negotiation leverage. |
| 7 | High-Cost Patient Identification | RANK() Window Function, CTE | Isolates extreme financial outliers for case management audits. | Trigger immediate clinical review of flagged patient visits. |
Operational & Volume | 3 | Monthly Trend of Visits | Date Functions, GROUP BY | Reveals seasonal demand patterns for staffing and resource forecasting. | Use the trend data for time-series forecasting models. |
Clinical Insights | 2 | Top 5 Most Common Diagnoses | GROUP BY, COUNT | Informs inventory management and helps standardize treatment protocols. | Correlate top diagnoses with average treatment cost. |
| 10 | Most Popular Procedure for Top Diagnosis | Subquery (Dynamic Nested Query) | Optimizes clinical pathways by linking the most common diagnosis to its frequent procedure. | Use finding to create departmental checklists and standards of care. |
Quality & Equity | 5 | Top Providers by Patient Satisfaction | HAVING Clause, AVG | Identifies quality champions and best practice providers for mentoring. | Study high-ranked providers' operational methods. |
| 8 | Department Performance (Cost/Satisfaction) | GROUP BY Dual Aggregation | Creates a comparative baseline (efficiency vs. quality) for departmental strategy. | Use data to build a Performance Scatter Plot (Python). |
| 9 | % of Emergency Visits by Gender | Conditional Aggregation (SUM(CASE)) | Analyzes gender differences in seeking emergency care. | Investigate if a specific demographic has barriers to routine care. |
Metric Definitions (Statistical Analysis summary)
Domain | # | Analysis Focus | Python/Library Technique | Core Insight Generated | Future Statistical Step |
Data Integrity & Risk | 1 | Descriptive Statistics & Outliers | pd.describe(), Quartile Check | Confirms statistical health of Total_Cost and flags if averages are skewed by extreme outliers. | If outliers confirmed, apply data transformation (e.g., log scale) for modeling. |
Relationship Modeling | 2 | Variable Correlation Analysis | pd.corr(), Seaborn Heatmap | Identifies the linear strength between variables (e.g., Age → Cost, Cost ↔ Satisfaction). | Use high-correlation variables (like Age) to build a Regression Model for cost prediction. |
| 3 | Cost Comparison by Service Type | pd.groupby(), Bar Chart | Quantifies the exact mean difference between Inpatient and Outpatient costs. | Perform an ANOVA Test to determine if this observed difference is statistically significant. |
Quality & Distribution | 4 | Satisfaction Consistency by Dept. | Seaborn Box Plot | Reveals the consistency and spread (variance) of satisfaction, identifying unreliable departments. | Target departments with high variance for quality standardization initiatives. |
Conclusion:
This project successfully established a robust, job-ready data pipeline from raw CSVs to actionable business insights. The analysis highlighted that Inpatient services are the major financial driver, while quality of care (satisfaction) must be addressed through operational changes, as it shows a weak correlation with cost. I have provided the necessary tools and metrics to guide the organization toward immediate cost-saving and quality improvement efforts.
Lessons Learned:
Database Design Precedes Analysis: Spending time on proper schema design, key enforcement, and date-type handling in MySQL saved significant time and prevented errors during the subsequent EDA.
The Power of Conditional Aggregation: The SUM(CASE) method in SQL and the .groupby() method in Pandas are versatile tools for translating binary business questions into quantifiable metrics.
Beyond the Average: Using Python's Box Plots was crucial for moving beyond simple averages to understand the full distribution of satisfaction scores, revealing inconsistency—a key insight that an average alone would have masked.
Integrating Tools: The ability to seamlessly transition from complex joining in SQL to statistical modeling and visualization in Python is the hallmark of a complete data analyst workflow.
Author:
Mukesh Shirke


Comments