Automobile Data Analysis
- Mukesh Shirke

- Jun 1
- 3 min read
Updated: Jul 20
Data-Driven Correlation Analysis for Vehicle Markets
A Python-powered exploratory analysis of automobile data was conducted to uncover patterns in vehicle usage, user behavior, and engagement metrics across multiple countries. Leveraging multi-month datasets and interactive visualizations built in Jupyter Notebook within Visual Studio Code, this project provides insights into visitor trends, traffic sources, device preferences, and page interaction levels. The analysis supports data-driven decisions for optimizing user experience and marketing strategy on automotive web platforms.
Link to Automobile Data Analysis Dashboard:
GitHub Repository:
Snapshot:


Project Background and Overview
The project leverages a widely-used automobile dataset to uncover actionable insights into vehicle pricing, technical features, and market segmentation. The analysis aims to support stakeholders—including manufacturers, marketers, and consumers—in understanding key factors that influence vehicle value and positioning.
Data Structure Overview
Data Source
Automobile Data Set from Kaggle (public domain, contributed by Toramky)
Data covers various car models from multiple manufacturers, with attributes including technical specifications, fuel economy, and price.
Files Used:
Automobile_data.csv – Attributes include make, model, body style, drive wheels, engine size, horsepower, dimensions, fuel type, and price.
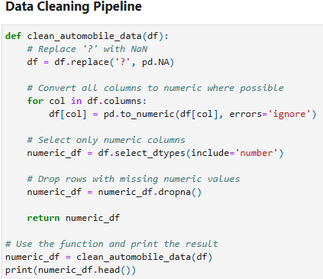
Data Preparation
Replaced missing values and standardized data types
Converted categorical variables for analysis
Selected relevant numeric and categorical features for correlation and visualization
Data Limitations
Some missing or inconsistent values in technical and price columns
Dataset may not fully represent the current automobile market or all global regions
Limited behavioral or usage data (e.g., owner demographics, real-world performance)
Analysis Summary
This analysis highlights critical relationships between technical features and automobile pricing. Key findings reveal strong correlations between price and specifications such as engine size, horsepower, and drive type. The dashboard enables users to explore data distributions, feature correlations, and market segmentation by technical and categorical attributes.
Snapshot of Findings:
Price is strongly linked to engine size, horsepower, and curb weight
Rear-wheel drive vehicles are generally priced higher, reflecting their association with performance and luxury models
Most vehicles in the dataset are standard passenger cars, with a few high-end outliers
Technical specifications and drive type play a significant role in market positioning
Insights Deep Dive
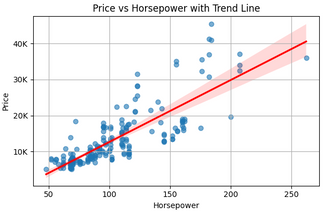
1. Price Drivers Larger engine size, higher horsepower, and greater curb weight are closely associated with higher vehicle prices.
Business Metric: Price correlation with technical features
Story: Manufacturers can optimize pricing strategies by emphasizing performance and premium specifications.
2. Drive Type and Market Segmentation Rear-wheel drive (rwd) vehicles tend to be more expensive, often representing luxury or sports models, while front-wheel drive (fwd) vehicles dominate the economy segment.
Business Metric: Price by drive wheels
Story: Drive type is a key differentiator in vehicle positioning and consumer targeting.
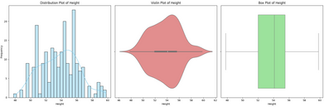
3. Feature Distributions Most vehicles cluster around moderate values for height, horsepower, and price, with a few high-performance or luxury outliers.
Business Metric: Distribution of technical features
Story: The dataset reflects a market focused on mainstream passenger vehicles, with niche segments for high-end models.
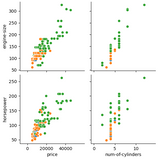
4. Correlation Patterns Strong positive correlations exist between price and technical features, while negative correlations are observed with fuel efficiency metrics.
Business Metric: Correlation coefficients among features
Story: Understanding these patterns helps stakeholders balance performance, efficiency, and pricing in product development.
Recommendations
Performance-Focused Marketing: Highlight technical features that drive value for premium segments.
Data Quality Improvements: Address missing and inconsistent values for more robust analysis.
Targeted Product Development: Use feature correlations to inform design and positioning of new models.
Further Data Collection: Integrate real-world usage and demographic data for deeper market insights.
How to Use
1. Explore the Dashboard:
Visualize distributions, correlations, and feature relationships
Filter and segment data by technical and categorical attributes
2. Reproduce the Analysis:
Download the data and code from this repository
Follow the documented Jupyter Notebook workflow for data cleaning, analysis, and visualization
License
This project is licensed under the MIT License.
Author
Mukesh Shirke
Explore the Jupyter Notebook for detailed code, data cleaning steps, visualizations, and the full analysis process. This project demonstrates expertise in data analysis, Python programming, and the application of data-driven insights to real-world challenges in the automobile market.


Comments